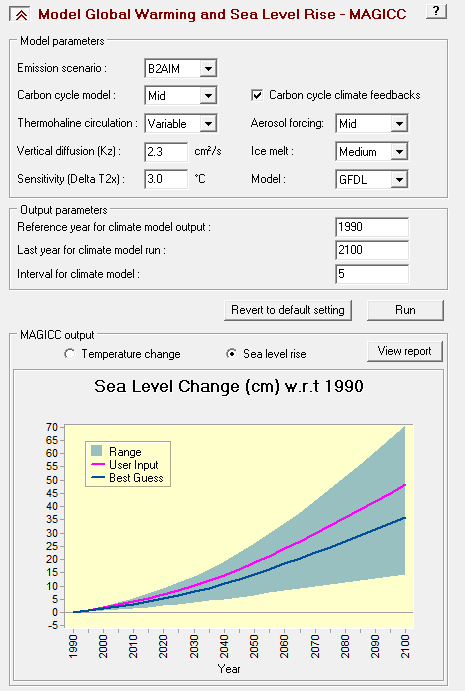
Terrset has a built-in Climate Change Adaptation Modeler that utilizes IPCC emission scenarios and different climate models to predict mean temperature change until 2100 and sea level rise. As time increases, the level of uncertainty with the results increases.
Modeling Global Warming and Sea Level Rise
Using this data, I ran four models using the GFDL climate model (Geophysical Fluids Dynamics Laboratory) created by NOAA (National Oceanic and Atmospheric Administration) with each of the emission scenarios given by the IPCC (NOAA, 2018). The Modeller outputs graphs, charts, and reports for increases in mean temperature and sea level rise based on the defined parameters of the model. Using this data, I can project the sea level rise using the next modeling tool.
Sea Level Rise Modeling Tool
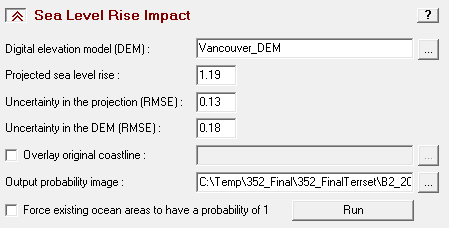
The built-in Sea Level Rise modeling tool uses four parameters: DEM, uncertainty within the DEM (RMSE), sea level rise, uncertainty in the sea level rise projection (RMSE). For the Vancouver DEM, the City does not provide metadata with an RMSE but does provide data on the vertical accuracy within a 95% confidence interval. This value is 0.18 metres and was substituted for the RMSE. For the RMSE of the sea level projection, the range of the projection is roughly two standard deviations. Therefore, the RMSE can be calculated by simply dividing the range at a given year by two and converting it to meters (divide by 100). To model sea level rise at a given year plus a king tide event, I just added 1m (100cm) to the projected sea level rise (City of Vancouver, 2018).
Boolean Analysis
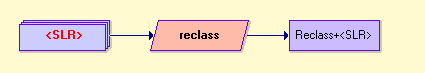
The Sea Level Rise Modeling Tool produces a map based on the probability of sea level rise at a given location on a scale of 0 to 1. Because the impact of sea level rise on the affected property is high, this analysis will be a low-risk model and therefore will use a boolean classification system. In order to prepare for boolean analysis, I used the RECLASS module to reclass all of the values in each sea level rise map with anything greater than 0 having a value of 1 and anything with a value of 0 remaining the same.
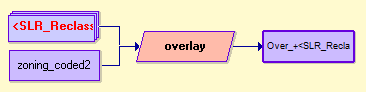
Then, I used the OVERLAY module (set to multiply) to perform the Boolean analysis on each map by overlaying the Sea Level Rise map for each scenario and year on Vancouver’s existing land use. Any area that is affected by sea level rise is multiplied by 1 to isolate the affected zones. Non-affected areas are multiplied by 0 to mask them out.
I then did the reverse (affected areas = 0, non-affected areas = 1) by using ASSIGN on the Reclassed sea level maps. This allowed me to produce boolean maps which show where sea level rise will occur (existing zoning turns to water) and where it will not by using the OVERLAY module and multiply.
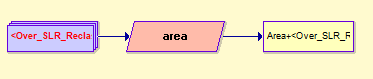
Calculating the Area Affected by Sea Level Rise by 2100
Using the AREA module, I calculated the area affected by sea level rise into an AVL file based on zoning. I then moved this data over to Excel for analysis.
References
City of Vancouver. (2018). Vancouver’s Changing Shoreline | Preparing for Sea Level Rise. Retrieved from https://vancouver.ca/files/cov/vancouvers-changing-shoreline-june-2018.pdf
NOAA. (2018). Climate Modeling. Retrieved from https://www.gfdl.noaa.gov/climate-modeling/